
PVC: Analysis of foreign demand for polyvinyl chloride PVC
Demand Analysis of Polyvinyl Chloride PVC outside China
1. Global demand Analysis of PVC
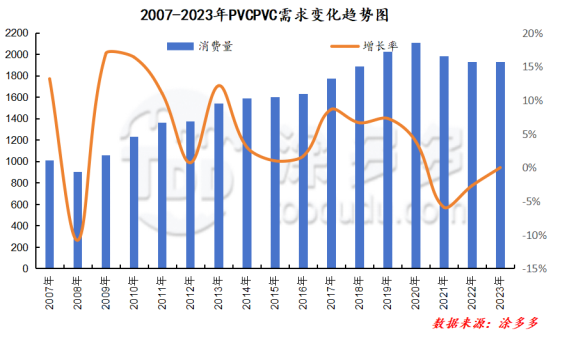
The growth rate of global PVC demand has slowed down since 2020. Affected by the epidemic and other factors, the total volume of global PVC trade has exceeded 10 million tons. At present, the largest net export regions of PVC are North America, Northeast Asia and Western Europe, while the main import areas are India, the Middle East, Southeast Asia and Africa. With the gradual development of Northeast Asia, India is relatively exuberant. Due to the rapid economic growth in India and the high demand for agricultural pipeline materials, China needs a large number of imports to make up for its own lack of production capacity. Global demand growth is expected to be about 3 per cent over the next three to five years. India and Southeast Asian countries such as Vietnam, Indonesia, Malaysia and Thailand maintain a good demand for chlor-alkali products, with an average annual growth rate of 5% and 9%.
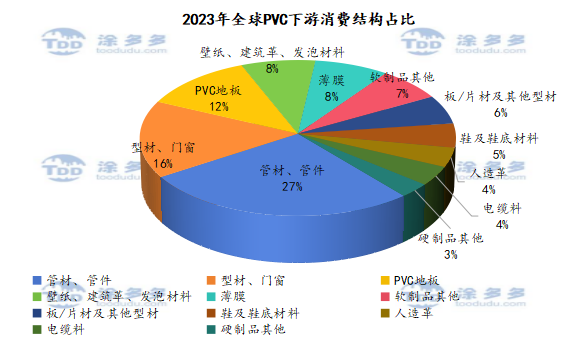
The downstream consumption field of global PVC is concentrated in pipe, pipe fittings, profiles, doors and windows, PVC floor, film, wire and cable, construction leather, wallpaper, etc., which is closely related to the construction industry. With the rapid development of emerging markets, the demand for PVC and other chlor-alkali products has maintained a steady growth.
II. Analysis on the consumption change of PVC downstream in China
PVC from the industry development stage, has entered the industrial maturity, with obvious multi-market characteristics, PVC downstream docking plastic processing industry, involving many plastic processing industry products, the largest consumption field of PVC is profile, profile and pipe, mainly used in the construction field, so the future development trend of China's real estate market plays a decisive role in the demand of PVC. In addition, China is currently in the process of urbanization, some infrastructure investment will also have a certain pulling effect on the consumption of PVC. However, in the past three years, the prosperity of China's real estate industry is insufficient, and the apparent consumption of PVC in China is insufficient.
III. Analysis on the subdivision of plastic products in China
In 2023, the Ministry of Industry and Information Technology and other three departments jointly issued the work Plan for steady growth of Light Industry (2023-2024), which proposed that the average growth rate of added value of light industry from 2023 to 2024 was about 4%, and the scale of business income of enterprises exceeded 25 trillion yuan. Plastic processing industry as one of the pillar industries of China's light industry, the year-on-year growth rate of output in 2023 closely follows the average growth rate of added value of light industry, which is basically in line with the expected target. The output of various segments of plastic products in 2023, including plastic sheet tube profiles, plastic silk ropes and woven goods, plastic packing boxes and containers, plastic parts and other plastic products, was still the highest, accounting for 62.1%. This was followed by plastic film, with an output of 16.954 million tons, accounting for 22.6 percent, of which agricultural film production was 821000 tons, an increase of 6.8 percent over the same period last year. In addition, foam production increased by 6.1 per cent year-on-year, daily plastic production decreased by 7.1 per cent, and plastic artificial leather and synthetic leather production decreased by 1.1 per cent.
|
Product output, increase and proportion in the Segmentation of plastic products in 2023 |
||||
|
Category |
Annual output (10,000 tons) |
Year-on-year growth |
National proportion |
|
|
Plastic film |
Total amount |
1695.4 |
2.1% |
22.6% |
|
Among them: agricultural film |
82.1 |
6.8% |
1.1% |
|
|
Foamed plastics |
266.9 |
6.1% |
3.6% |
|
|
Daily plastic |
563.2 |
-7.1% |
7.5% |
|
|
Plastic artificial leather and synthetic leather |
229.2 |
-1.1% |
3.1% |
|
|
Other plastic products |
4651.7 |
-5.9% |
62.1% |
|
|
Total amount of plastic products |
7488.5 |
3.0% |
100.0% |
|